Live Event + Dispatch Map
Interactive Platform and Installation Case Study 2019

This case study contains two parts of the Live Map: The Live Event Map, and the Interactive Dispatch Map.
Interactive Dispatch Map
This case study contains two parts of the Live Map: The Live Event Map, and the Interactive Dispatch Map.
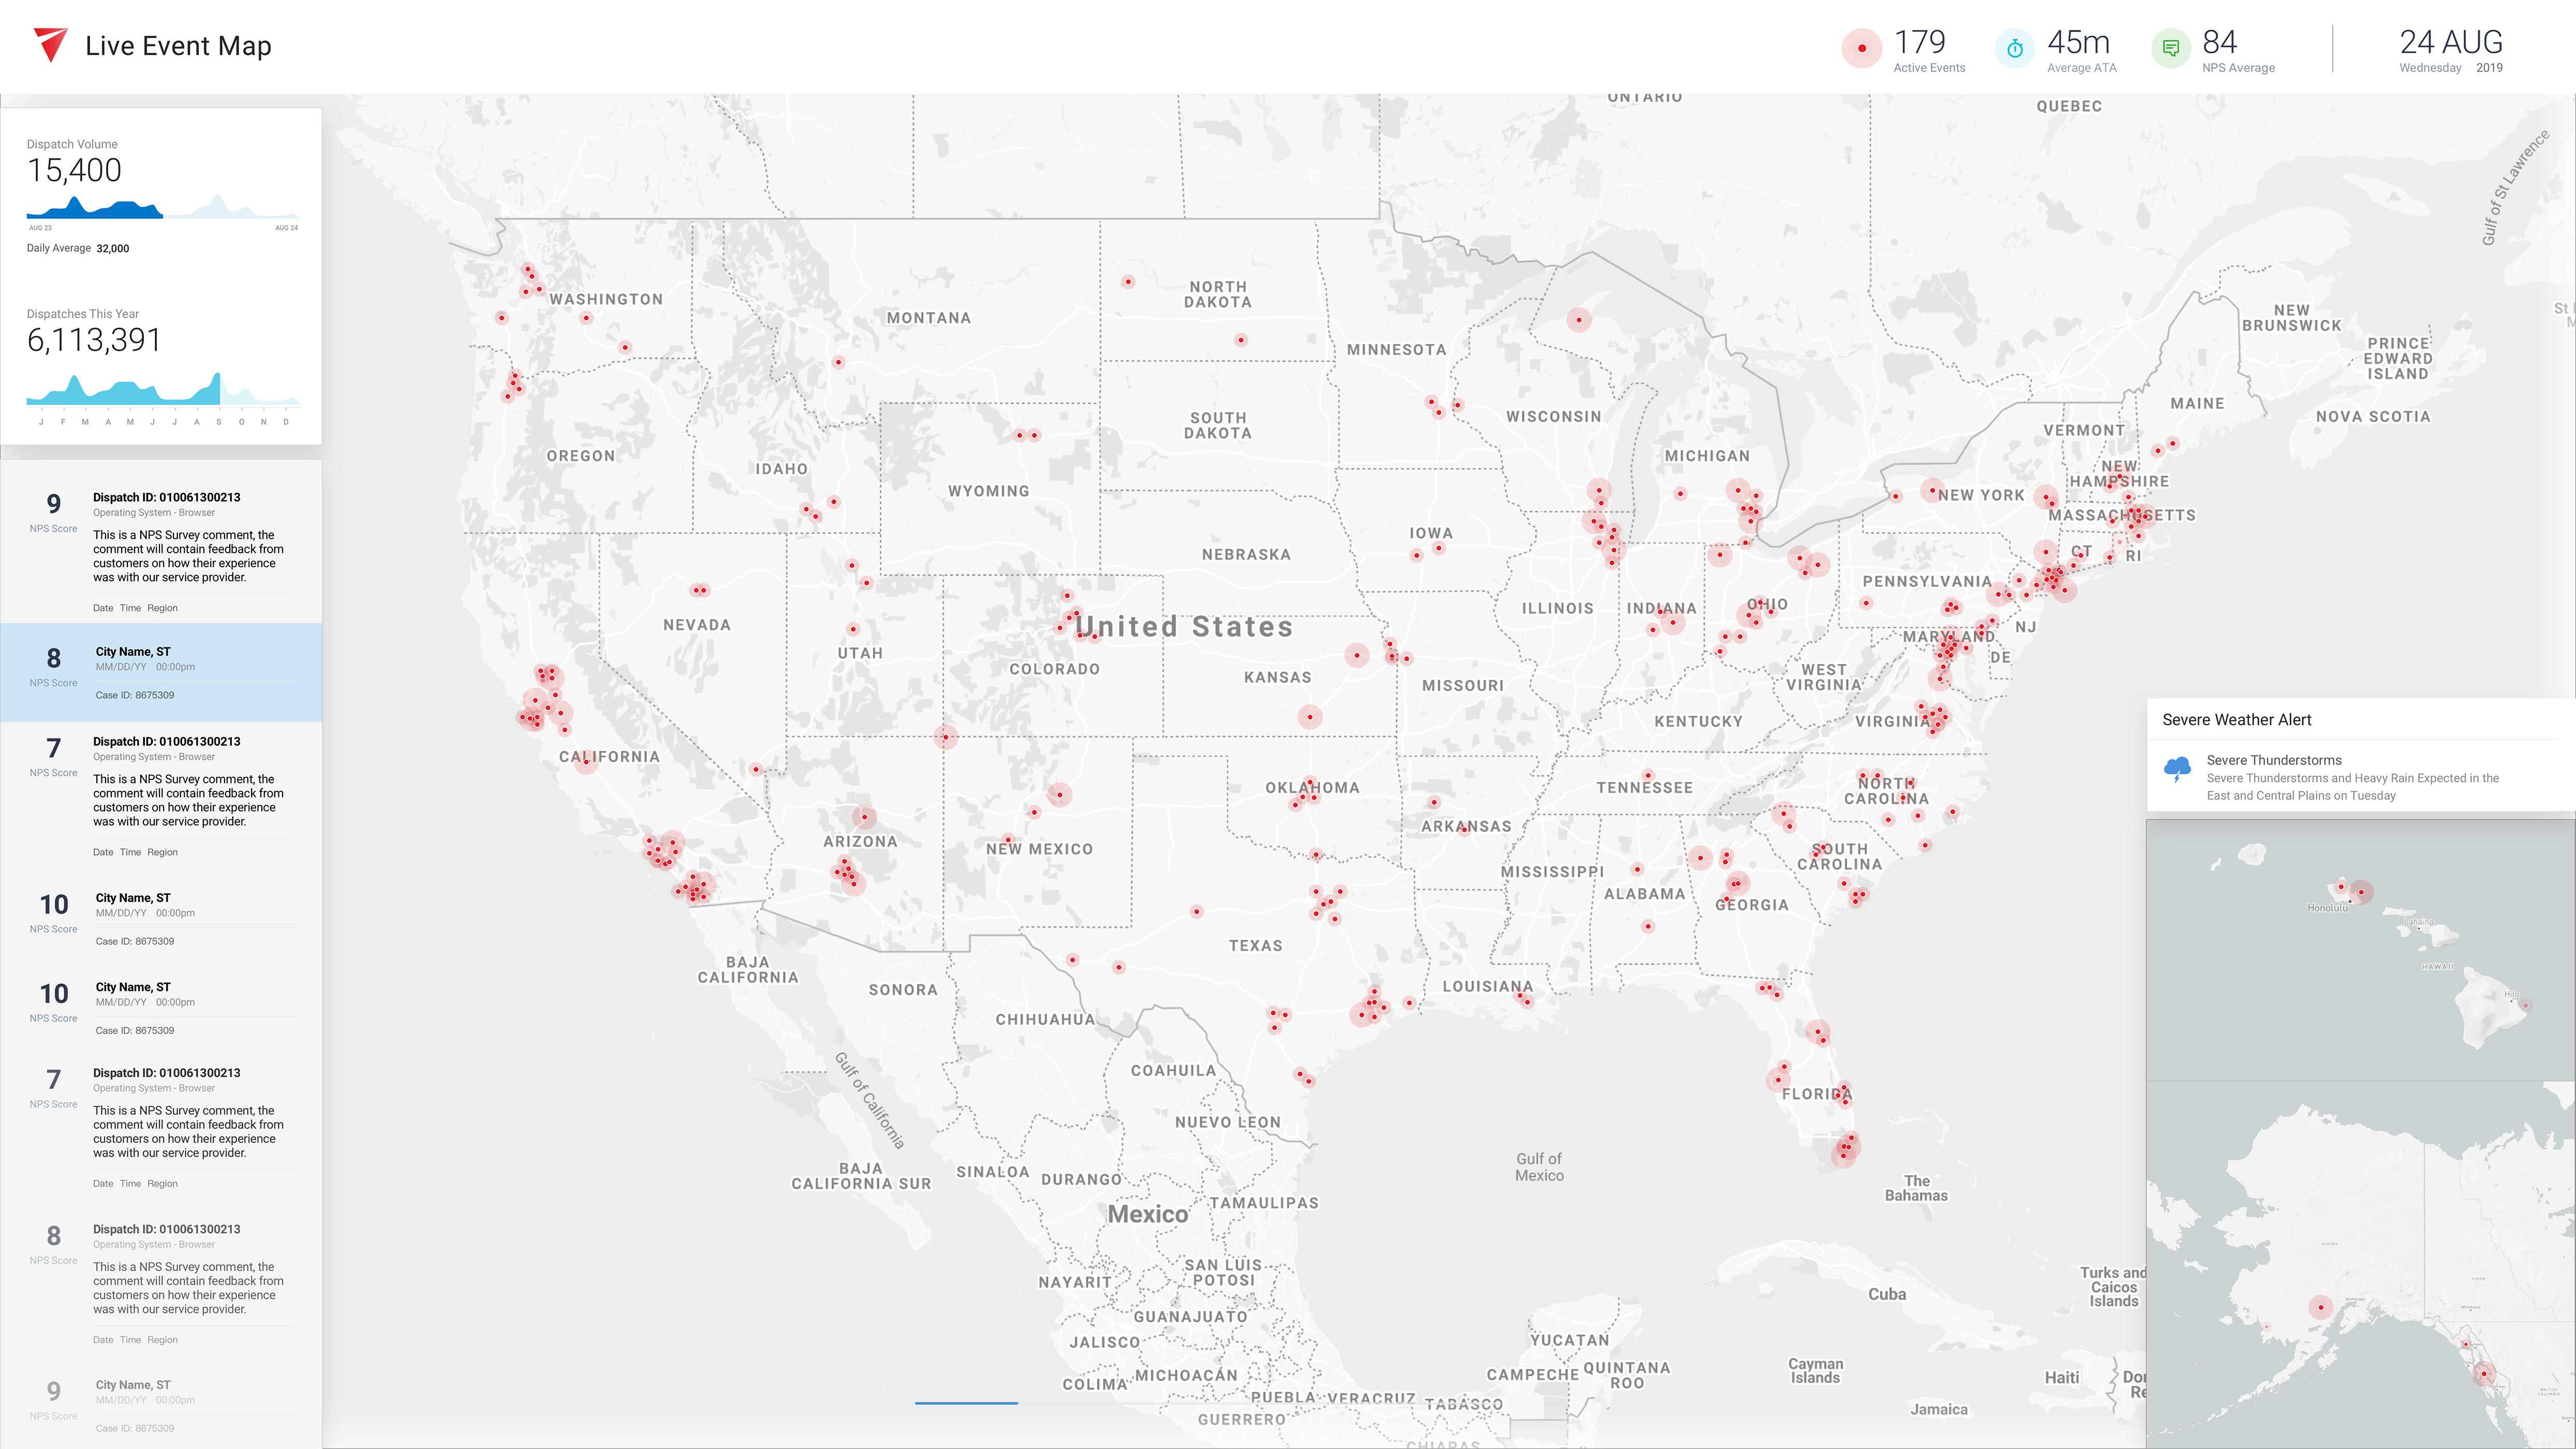
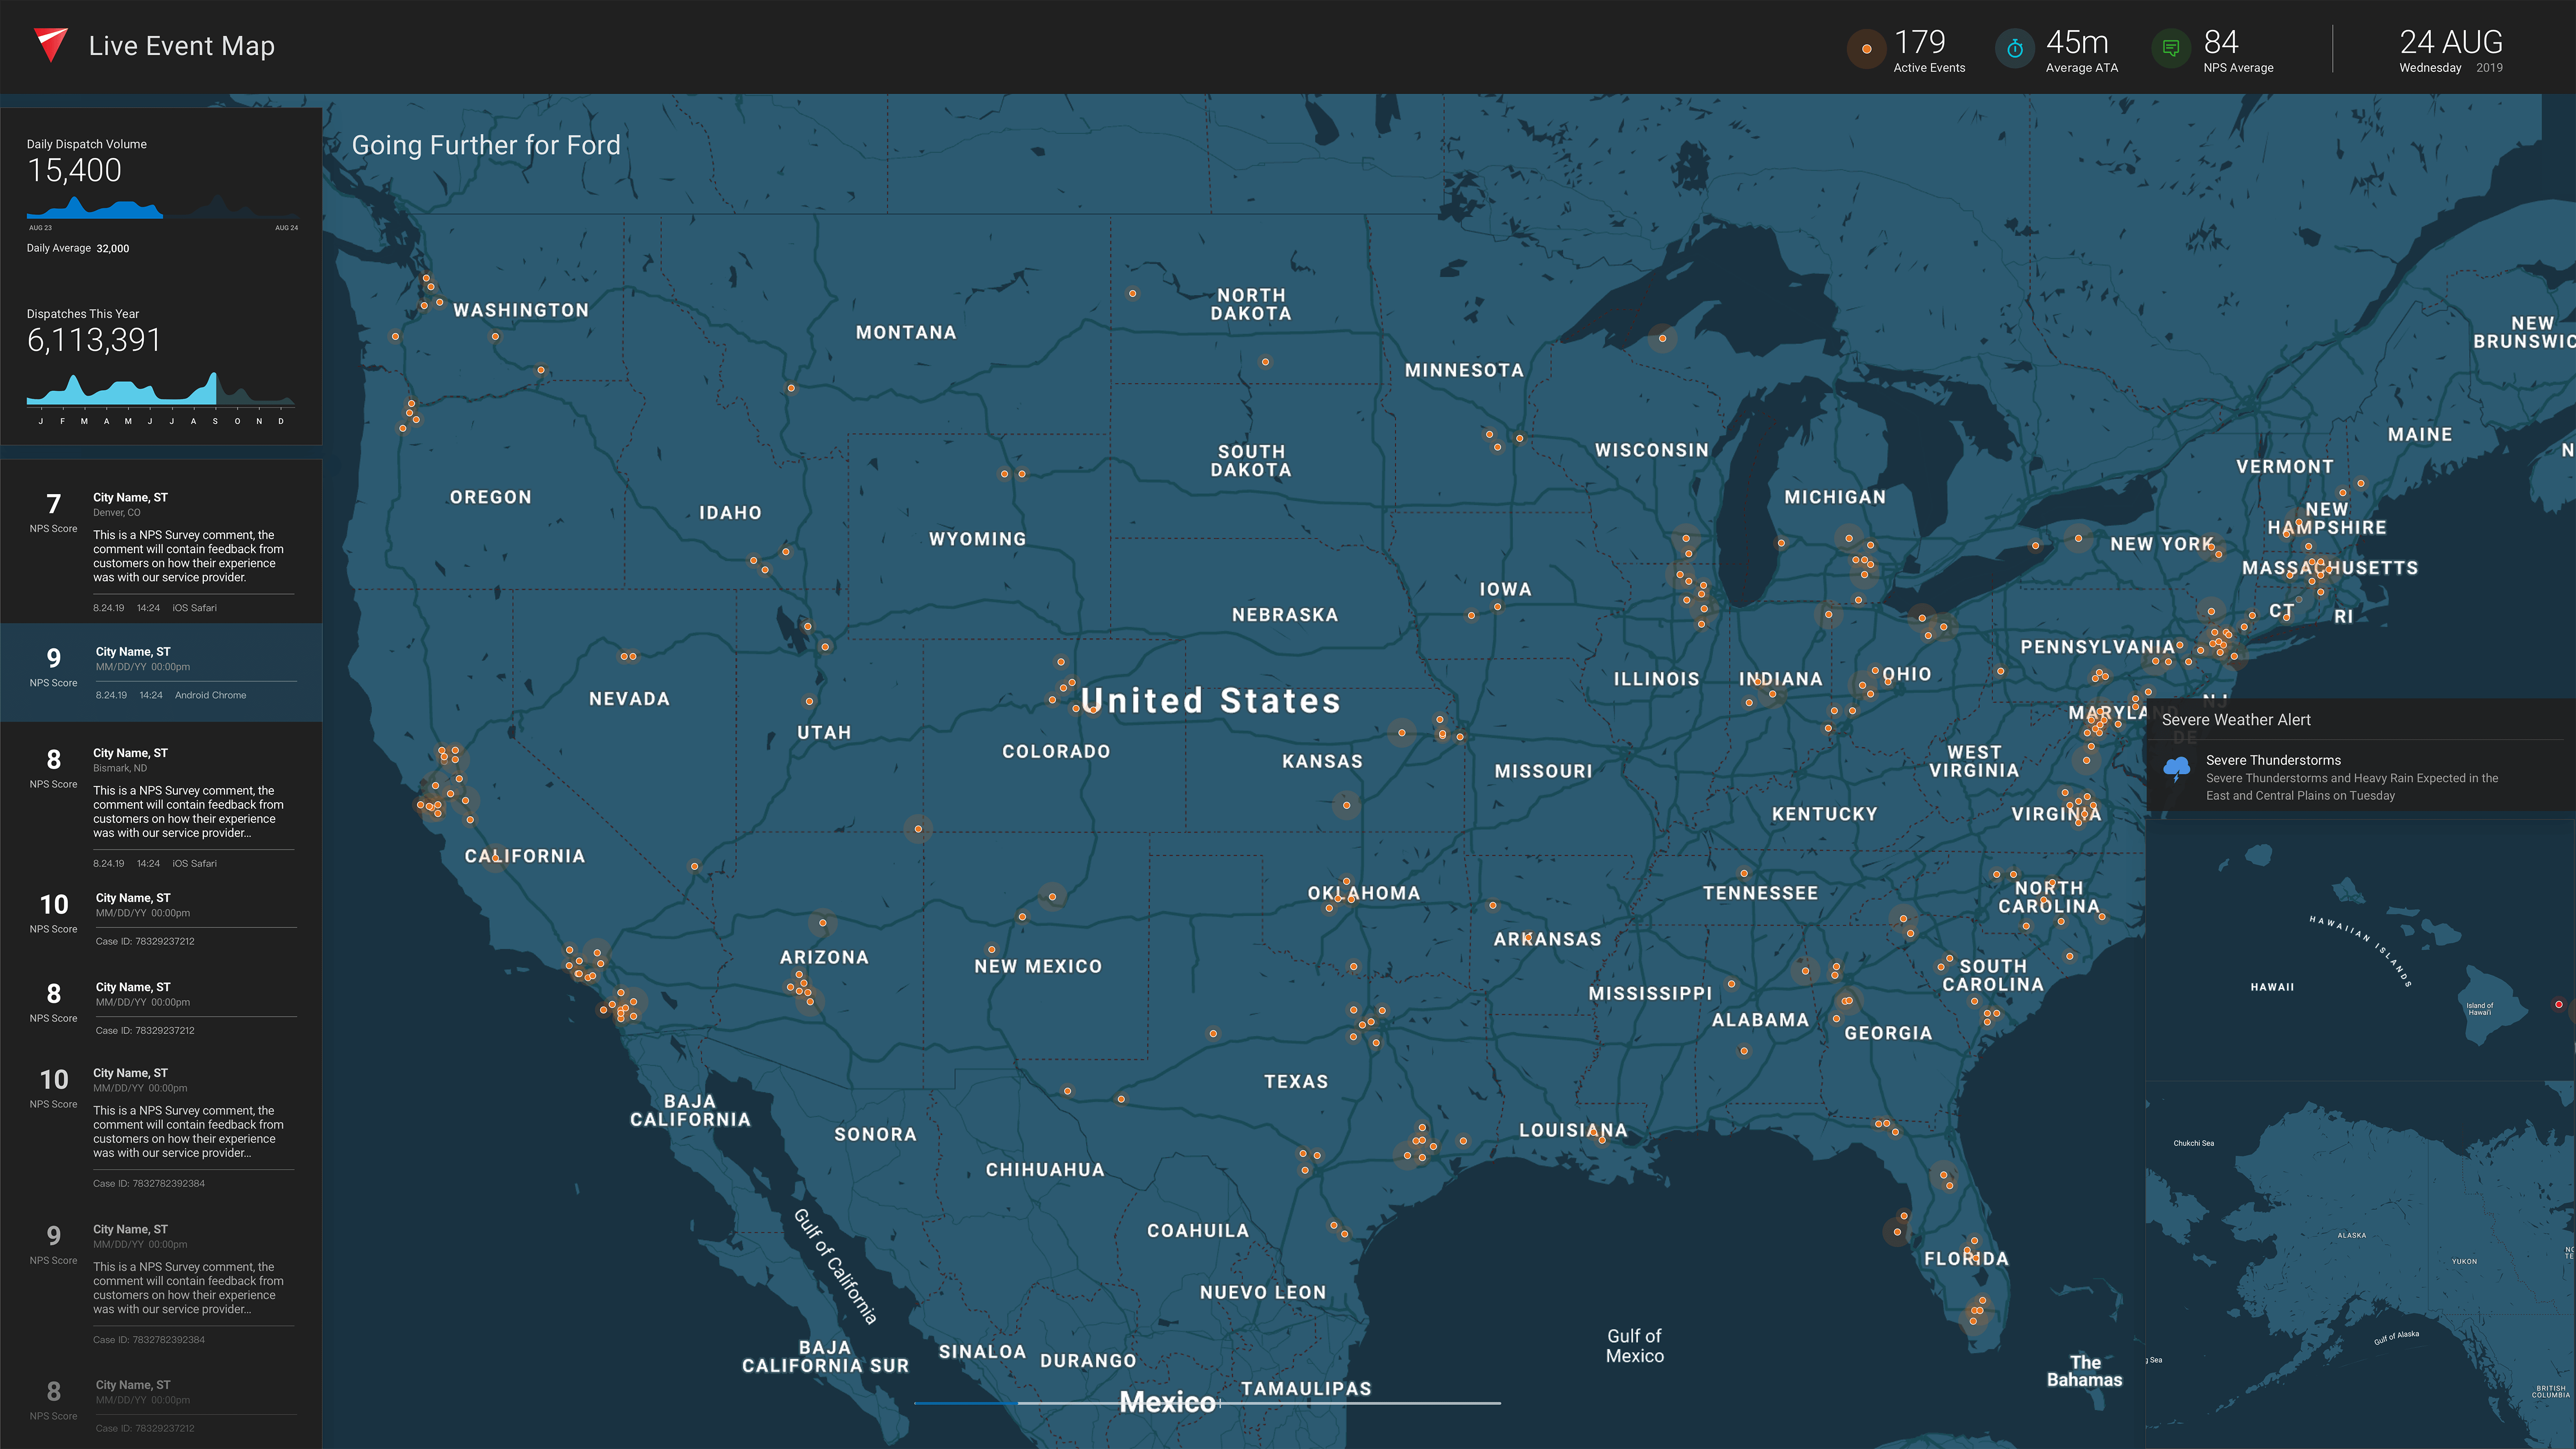
The Live Event Map - Day / Night
Our live event map is a key way that we show our clients the coverage and scale that we cover nationally in the US. Each dot represents an active job and flash as they get added or removed. A key feature to this map was to show something new: transparent NPS reviews from customers. This map is fully live and up-to-date thanks to the amazing data science team at Agero, and was so successful that we have it on display in the lobby, boardroom and main floors of all of our contact centers.
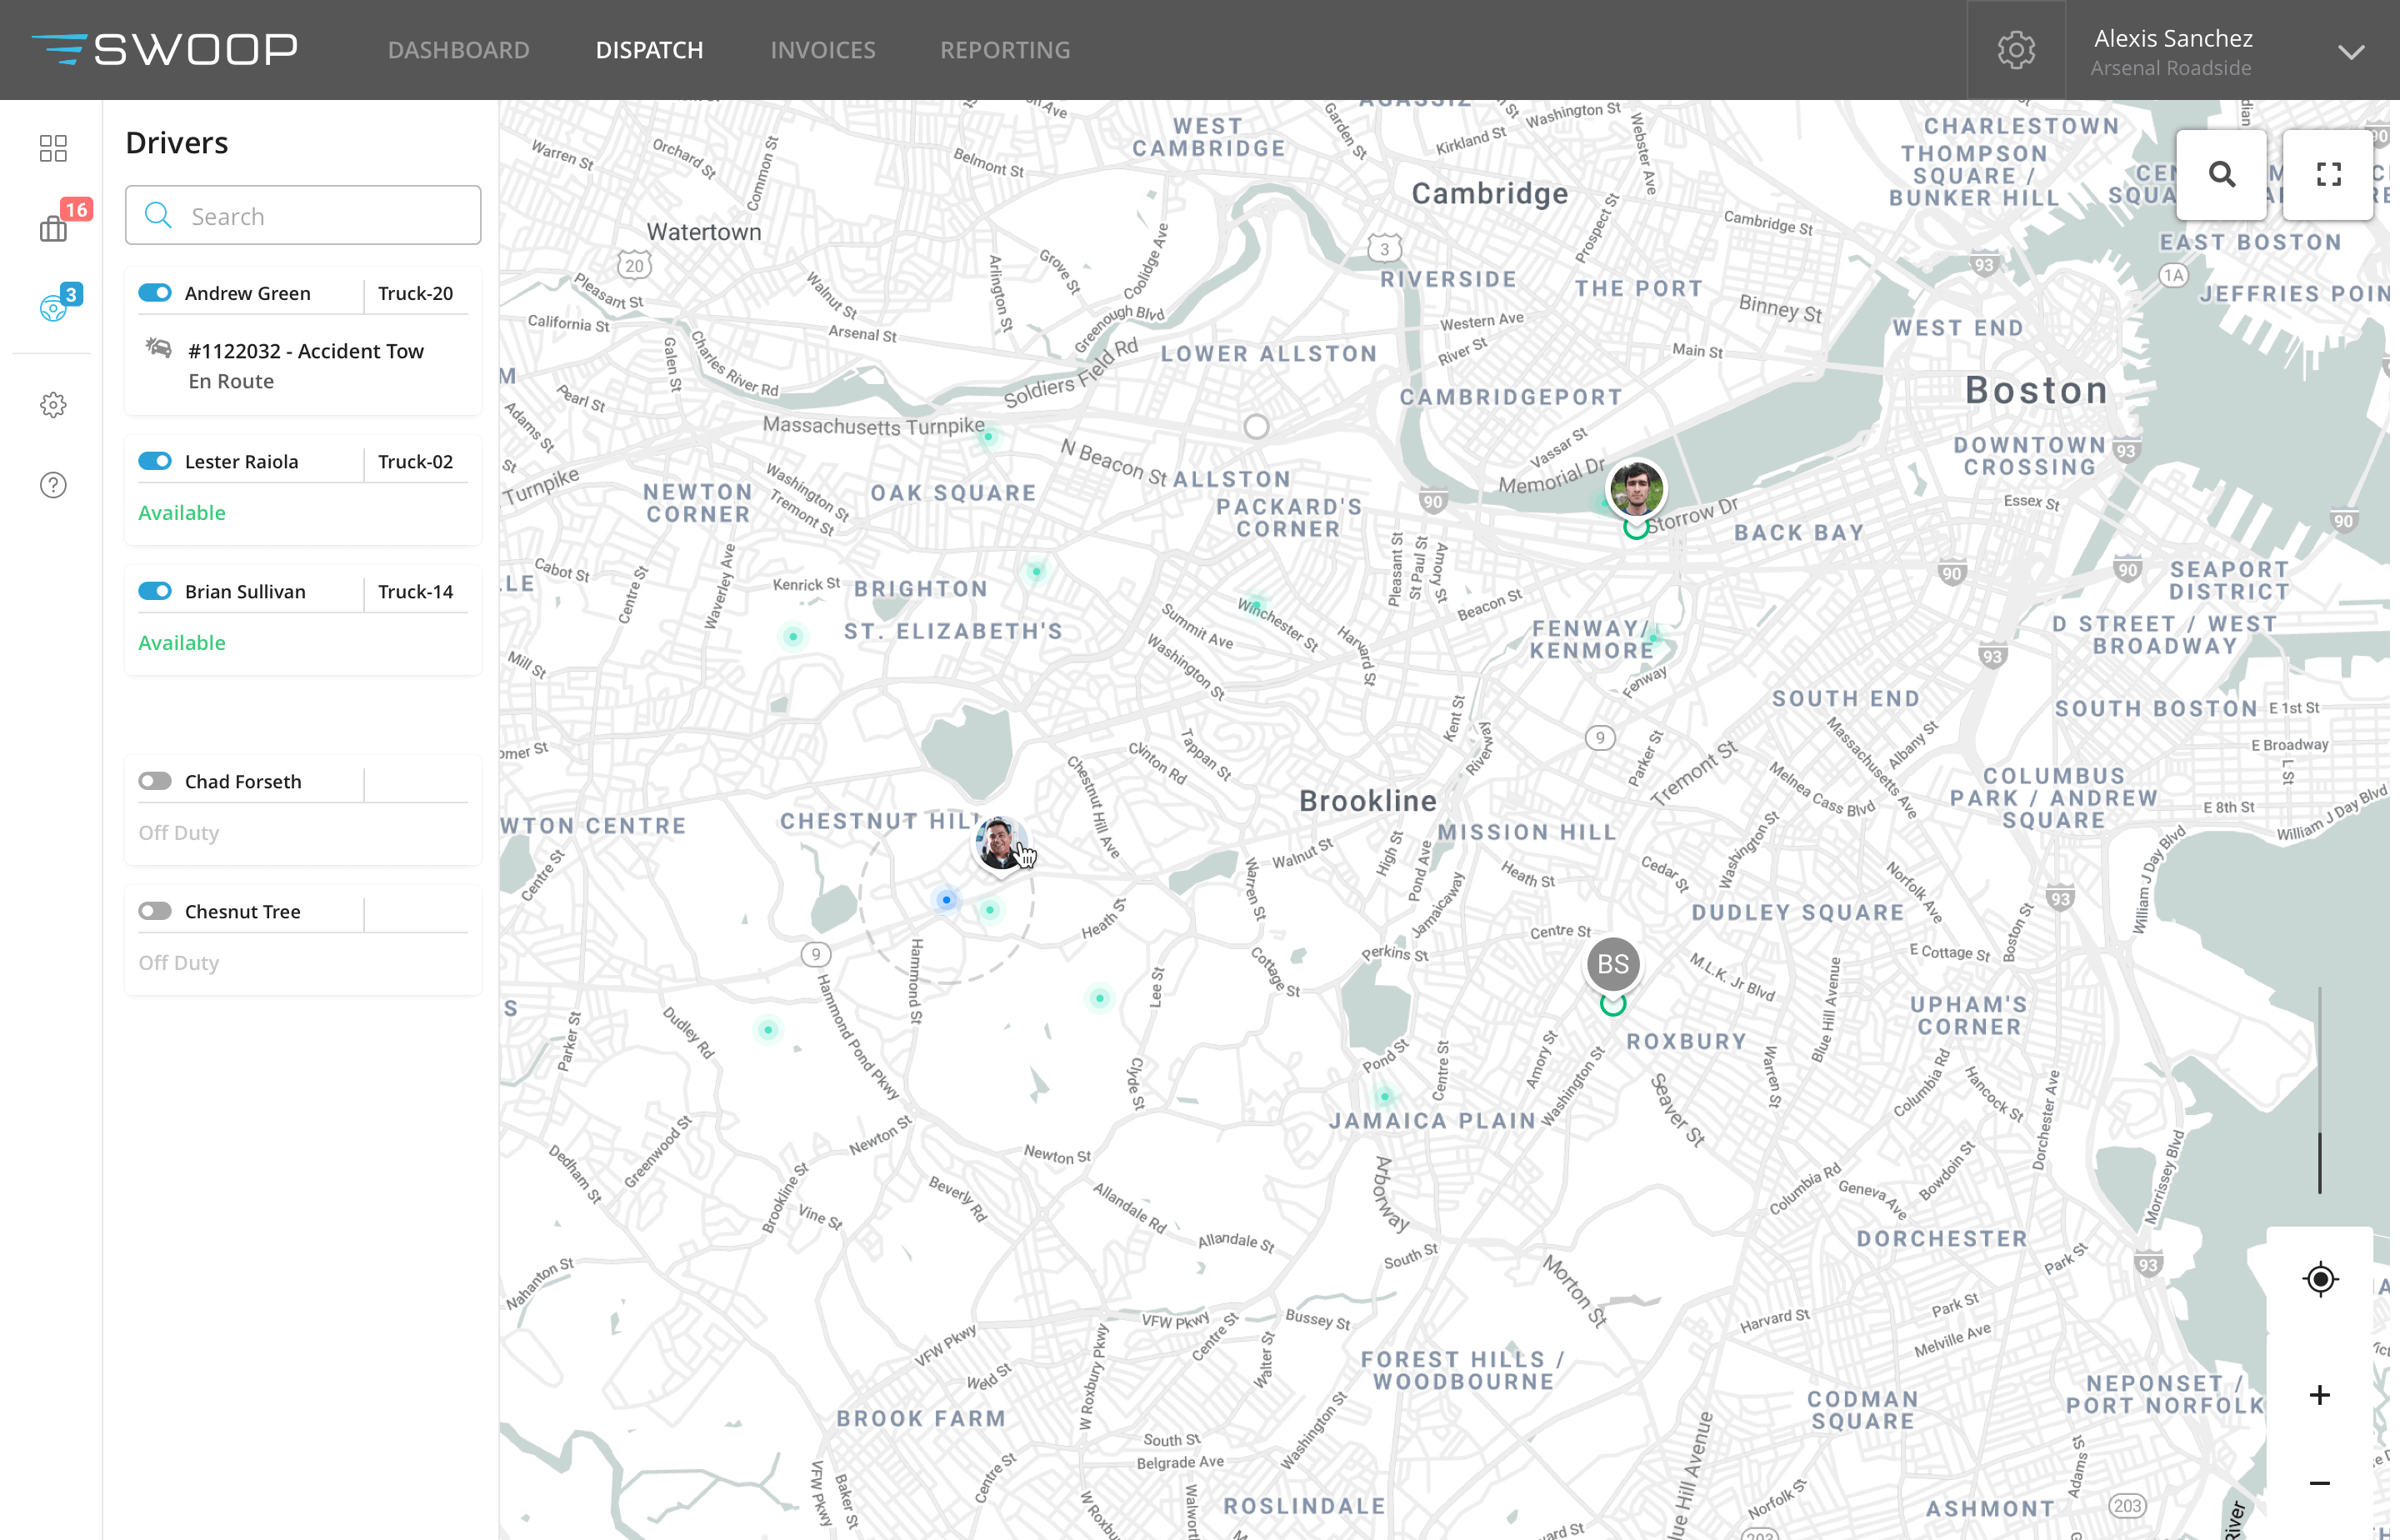
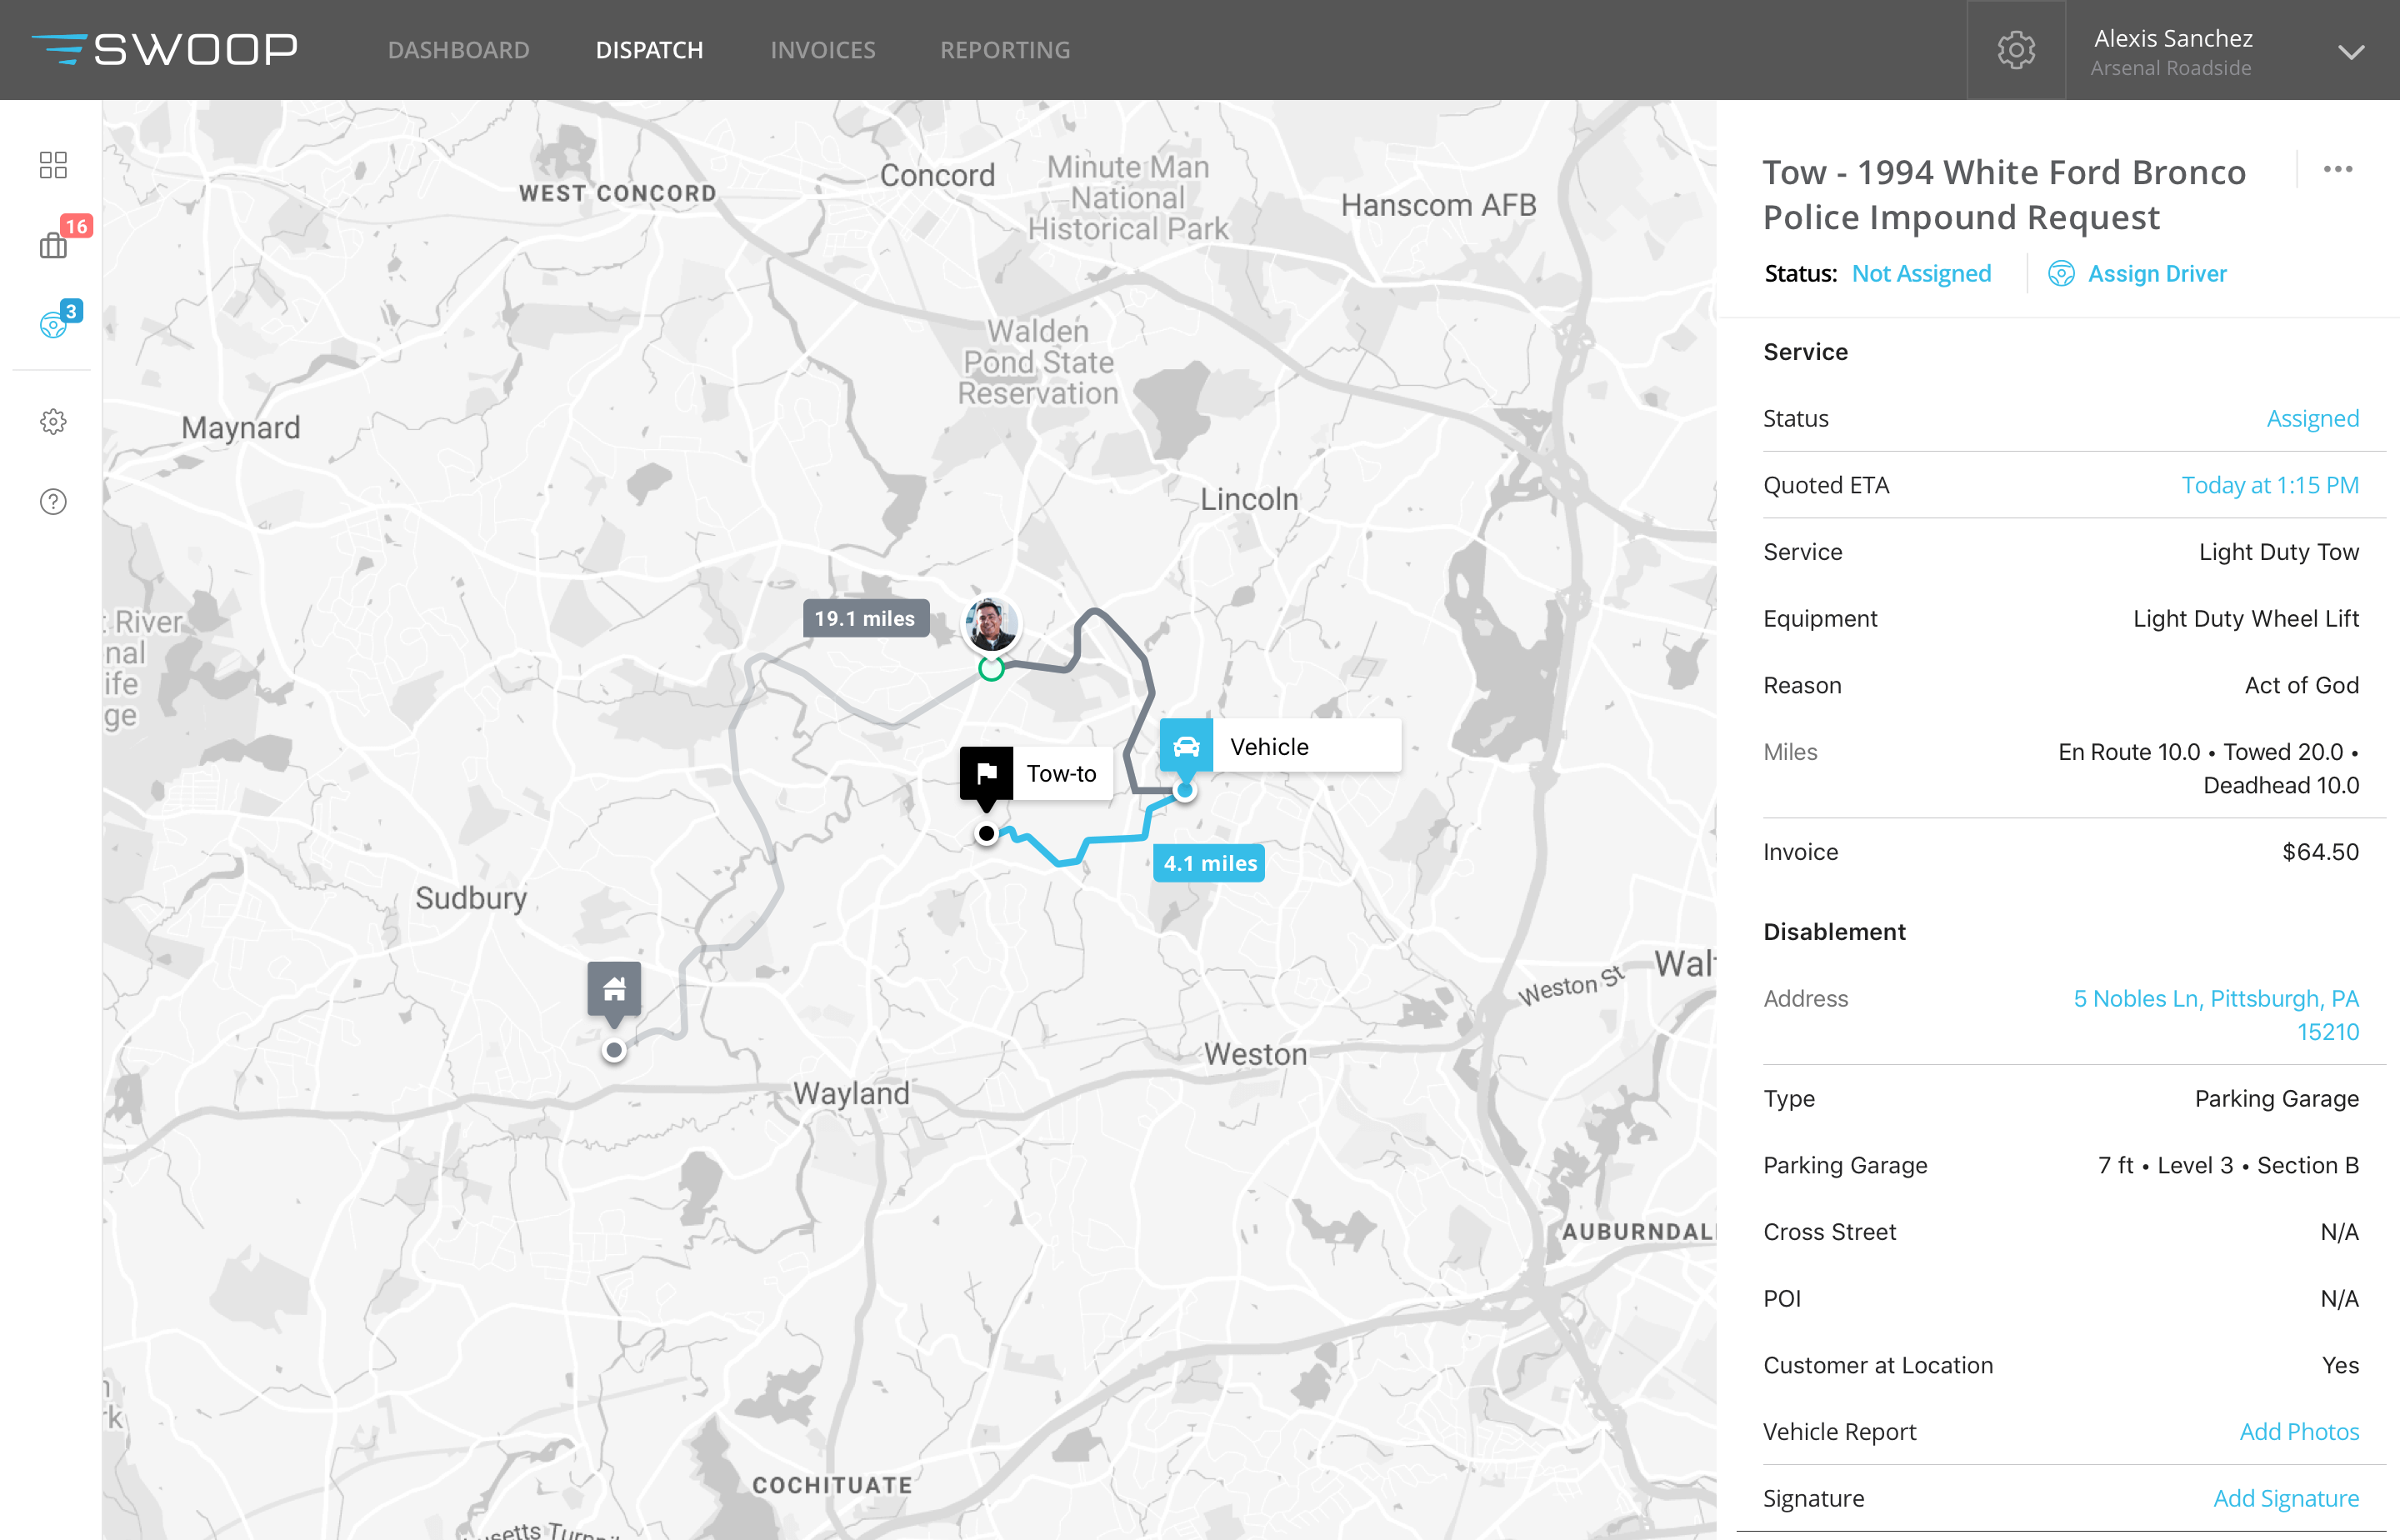
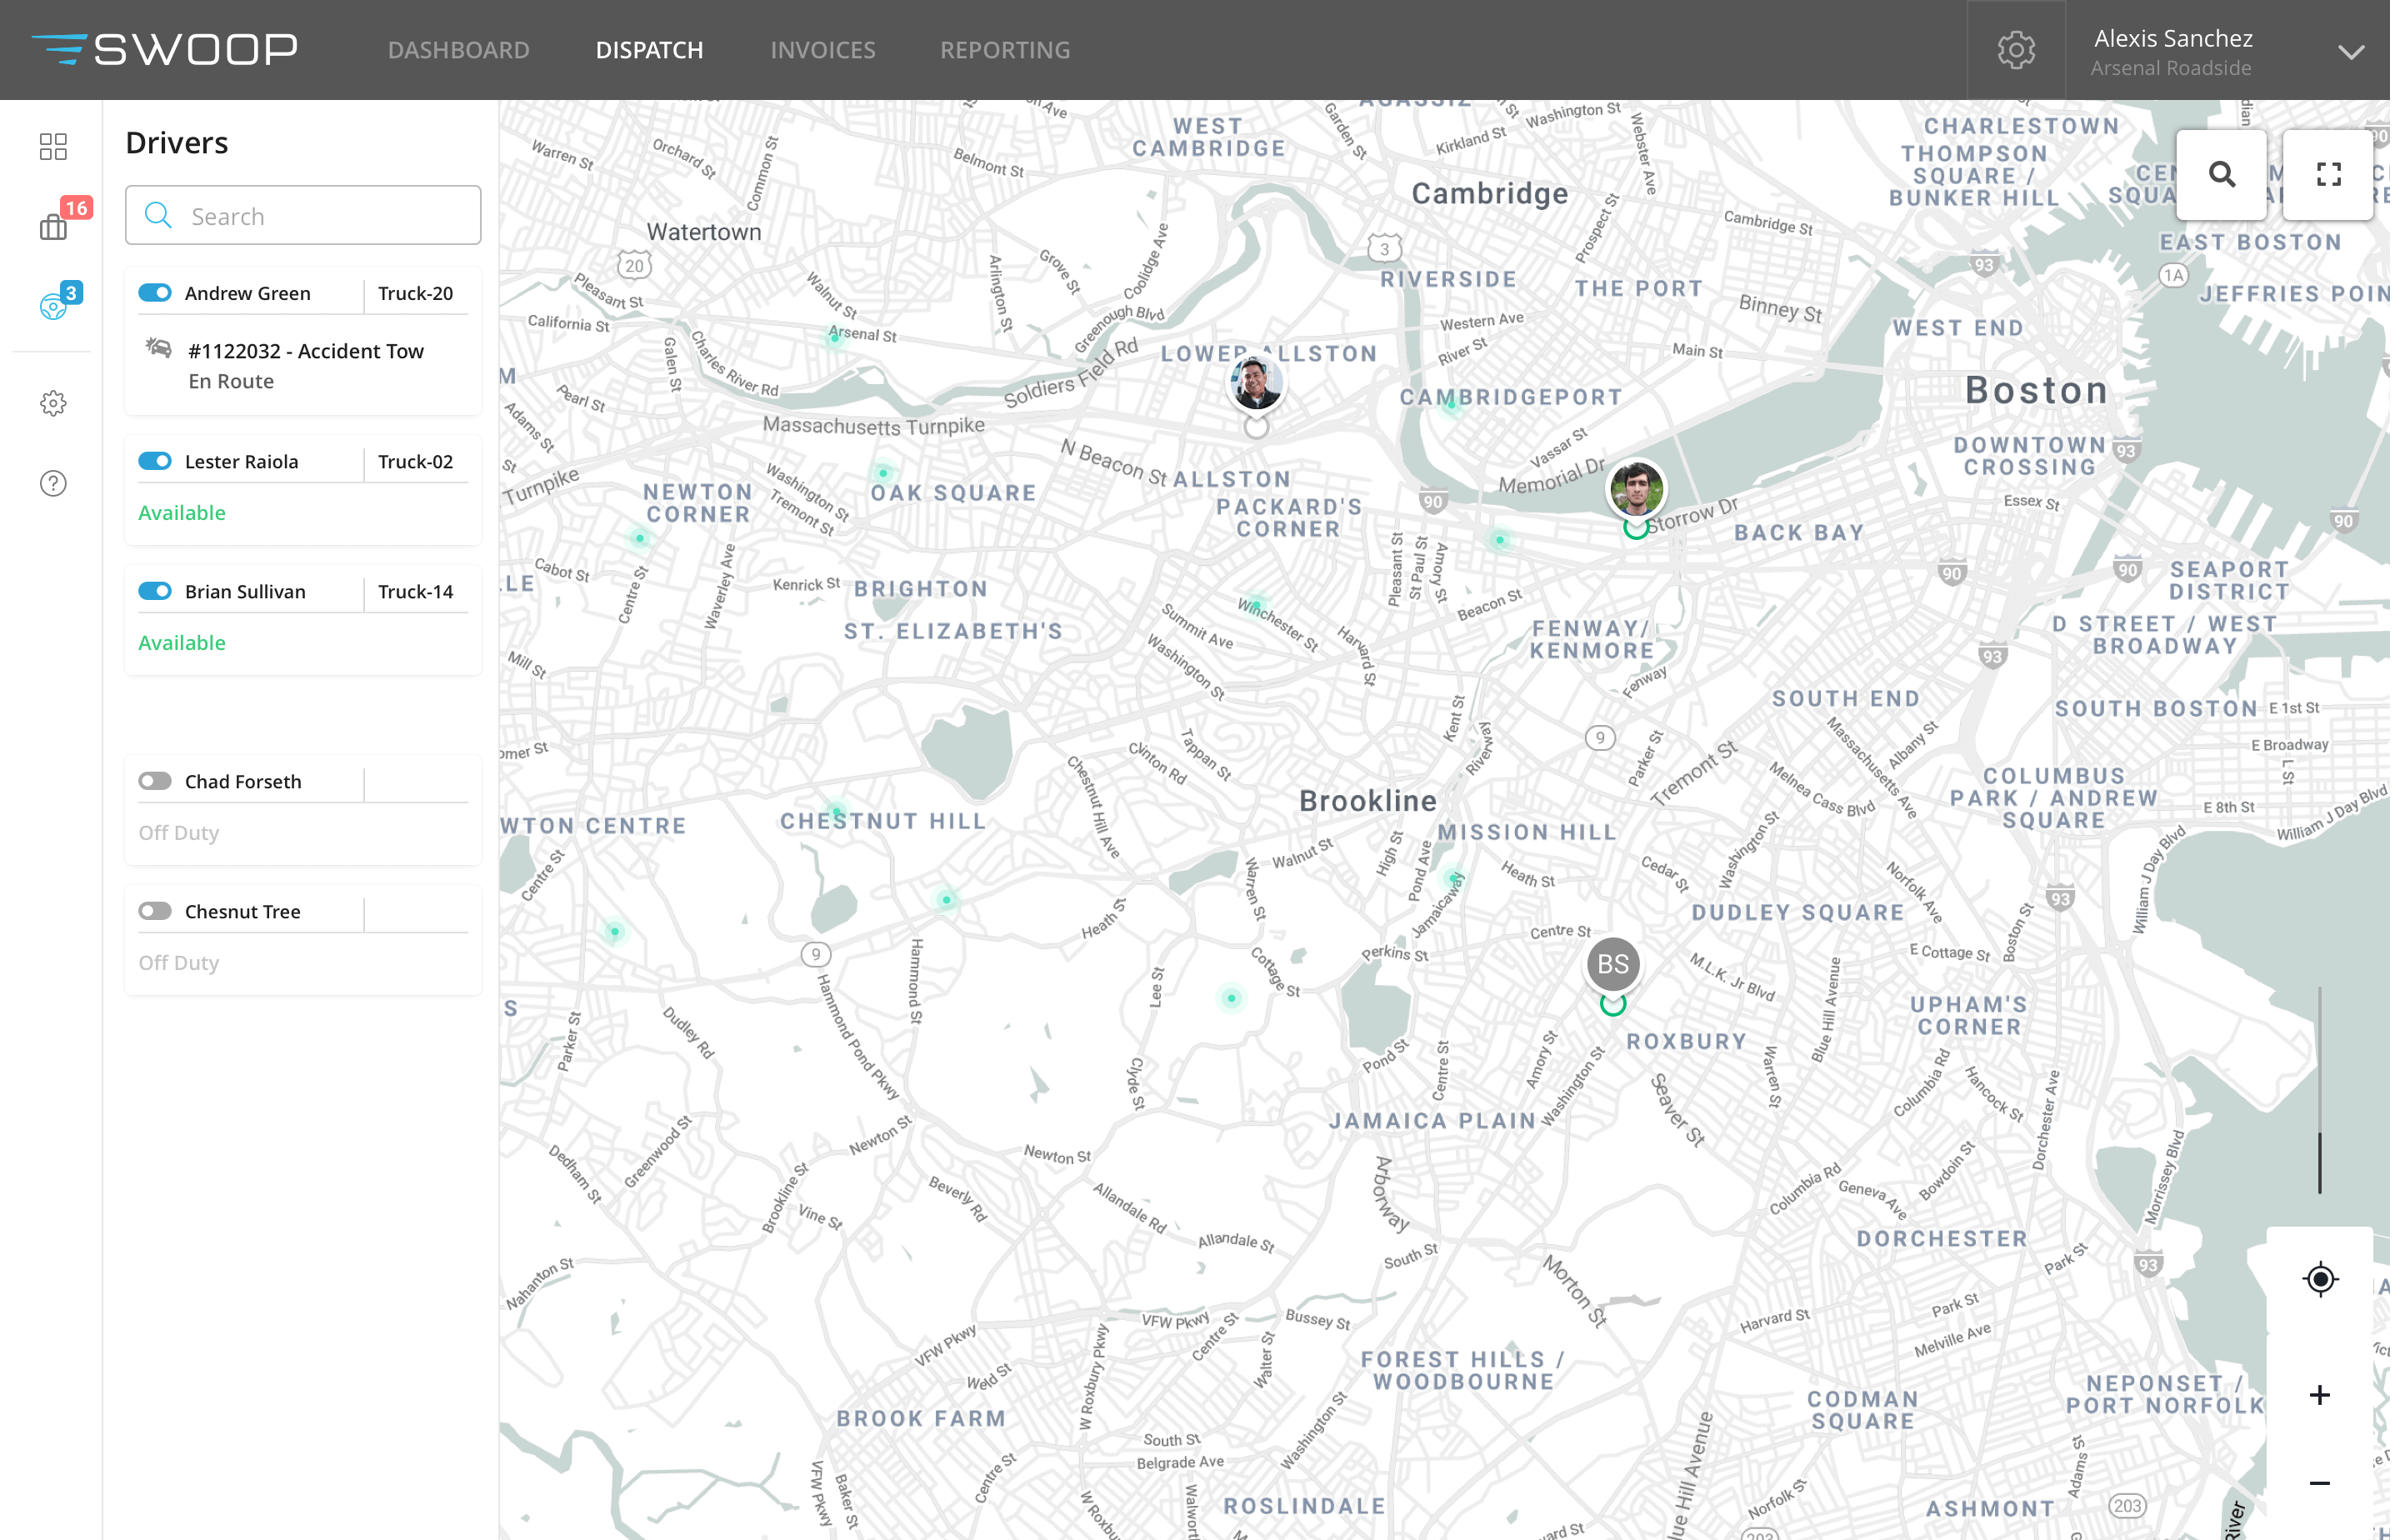
Interactive Dispatch Map
The Interactive Dispatch Portal is a brand new way to handle dispatches. Large towing companies and other fleet based clients prefer to have a more visual way of managing and dispatching tow trucks.We not only wanted to just show a map, but allow for deeper levels of planning and strategy. By tracking drivers on the map and seeing where they are going and coming from, the map allows you to better stack up multiple jobs in order to save fuel costs and allow for more jobs per day without as much lag time.
GUI and Element Breakdowns


Contact
Connect With Me
Copyright
© Andrew Green 2024